Deciding where to start testing a product is an art. Especially when the product has been in development for a while. And things seem to be breaking all over the place. Here is a technique we use to identify places where testing can show immediate value - even for products we barely know. We usually spend no more than 2 days on this step. Execute these steps well and you gain instant credibility for yourself and for all future testers.
NOTE: These steps are subjective and need you to exercise your judgement and make educated guesses.

At a very high level, you figure out the people interacting with your product, what each of them care about and to what degree. Then visualize the product in several ways - mind maps, ACC model, workflow maps, layers model and risk scatterplots. Our goal at this point is to come up with useful mental models of the product that help us identify reasonable starting points for testing. The color-coded graphs, charts and maps also make good backdrops for initiating conversations about improving the product.
Start by asking yourself what problem your startup is solving. Who pays for your product? Who ends up using your product? Then scan sales and marketing material (website, demos, webinars, press releases, interviews, conference talks by founders) to figure out what your leadership thinks is important and worth highlighting. Then speak to client-facing colleagues (sales and tech support members are a gold mine!) to see how they perceive the value and risks to your product.

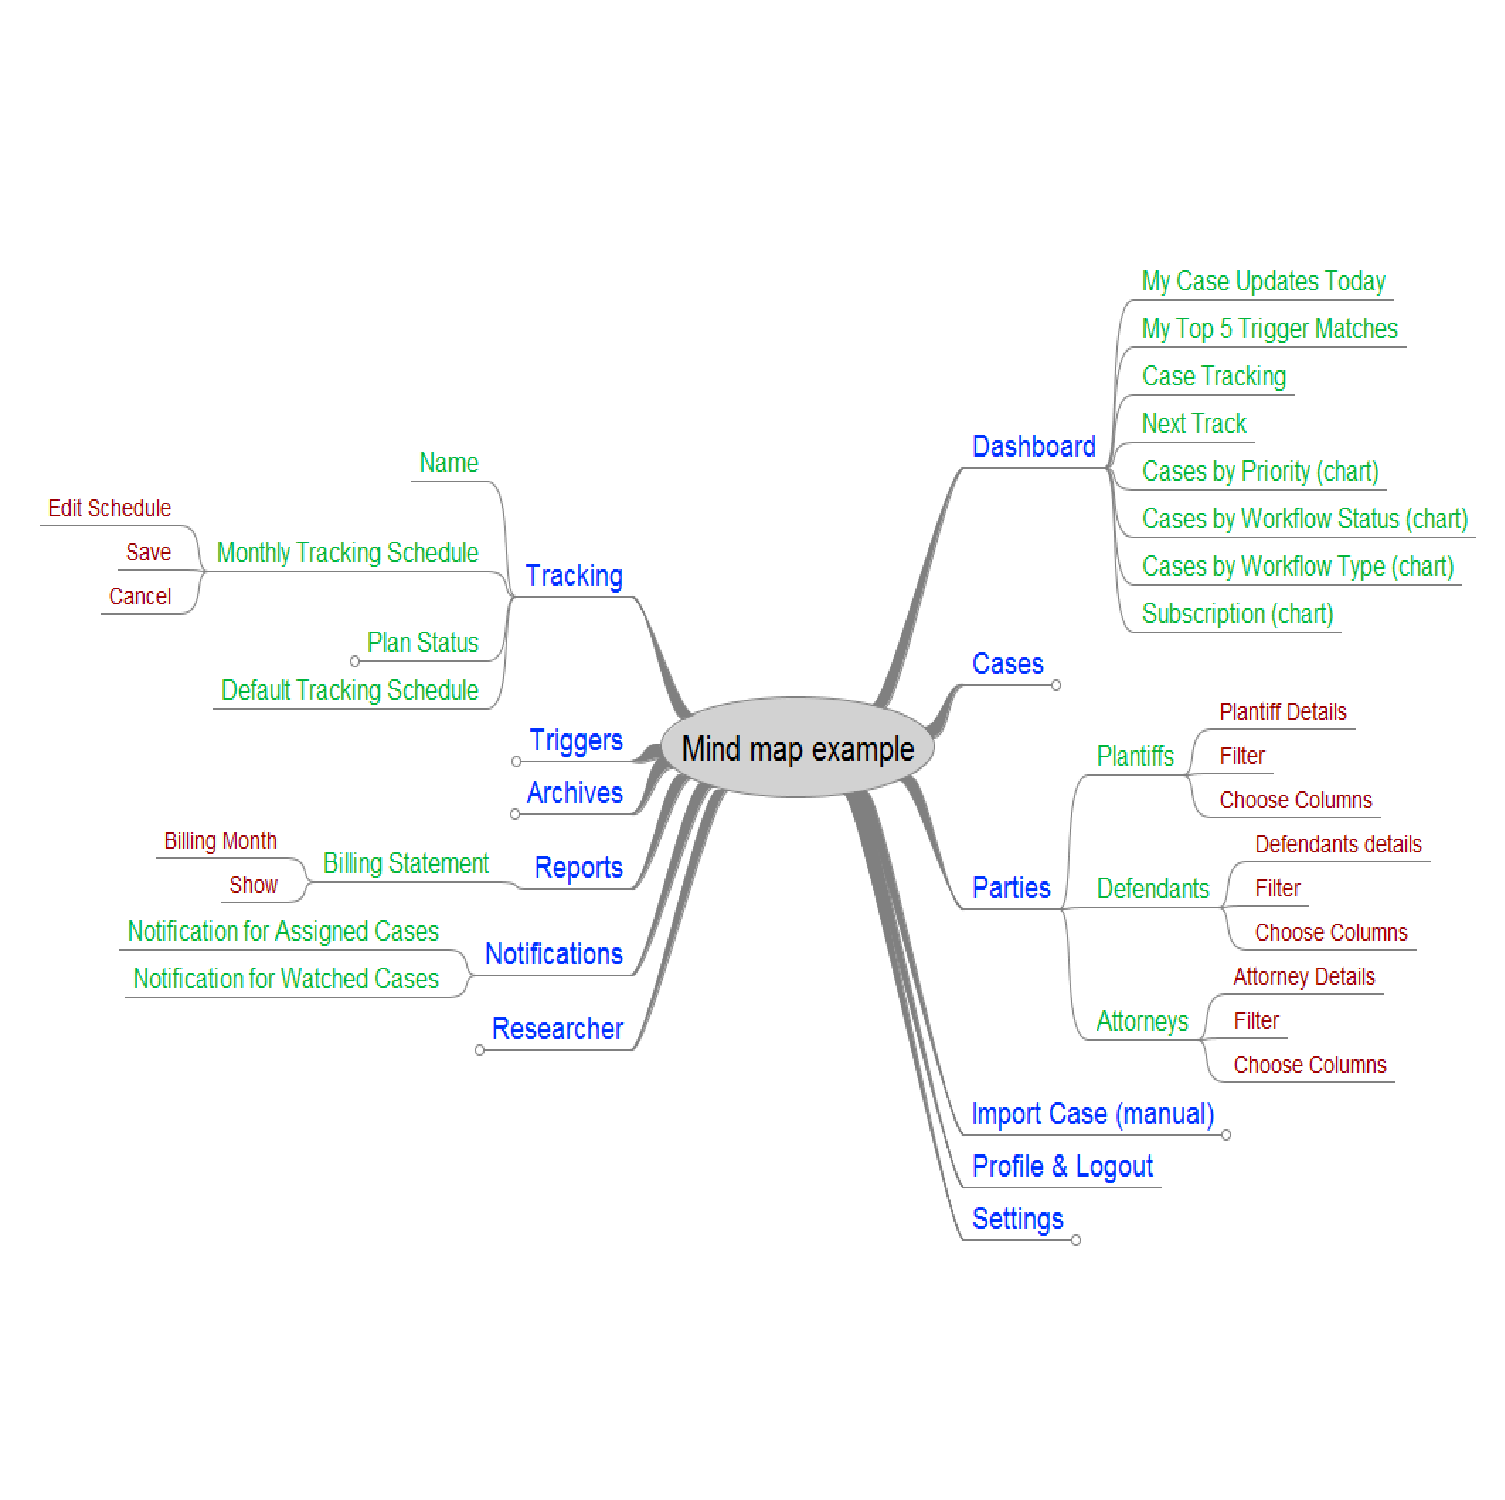
Explore the product on your own. Create a mind map (use FreeMind) of the product showing the different sections and features of the product. Mind maps are one way to visualizes your product. They are an intuitive way for testers to list out the features within a product. At a recent engagement, the CEO saw the mind map for his product and was amazed at how many features his young product already had! Bonus trick: Fully expand the mind map and zoom out till the entire mind map fits your screen. You can quickly spot imbalances - some areas are feature rich and other areas are sparse.
If you notice extreme imbalances, ask your product owner about the history of those features. There are bound to be some interesting stories that will correlate somewhat with the quality of those areas.
After the mind map is ready, we usually use the ACC model to visualize the current pain points with the product. You can watch an excellent and detailed video by James Whittaker about the ACC model here.
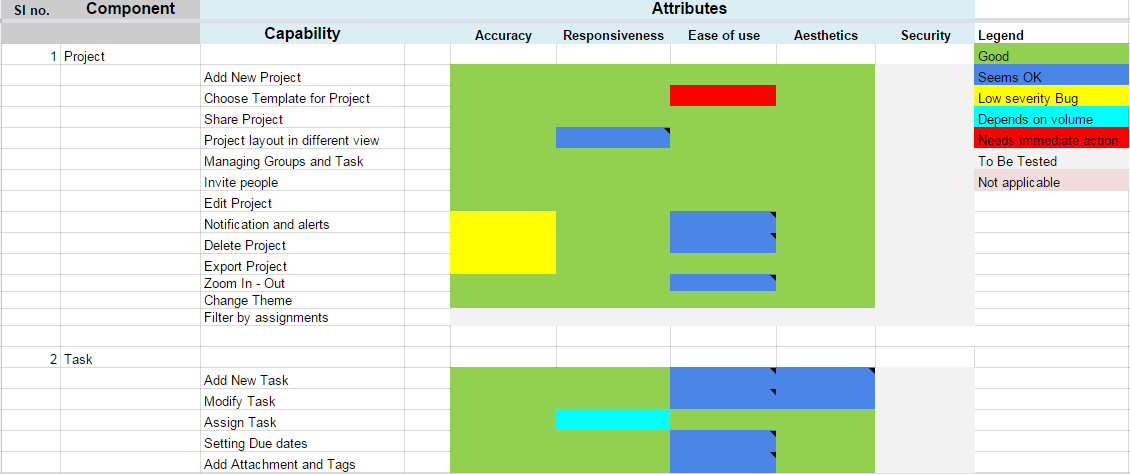
A quick summary is that you list all the sections (e.g.: User management) in your product a.k.a Components. For each section you list out its features (add user, delete user, edit user) a.k.a Capabilities. Then list the adjectives (e.g.: accurate, fast, scalable, user friendly, secure) that you would like users to describe the product with. Convert it into a color coded matrix - listing the different components and their capabilities in one column and the attributes across the row. Assign colors for how well each capability is doing for each attribute. The colors are subjective - but at this stage its ok. If you are wondering how to identify problems in a product you barely know, use the FEW HICCUPPS heuristic by Michael Bolton and James Bach. At the end of this short exercise you will have a visual understanding of places where your product is lacking.
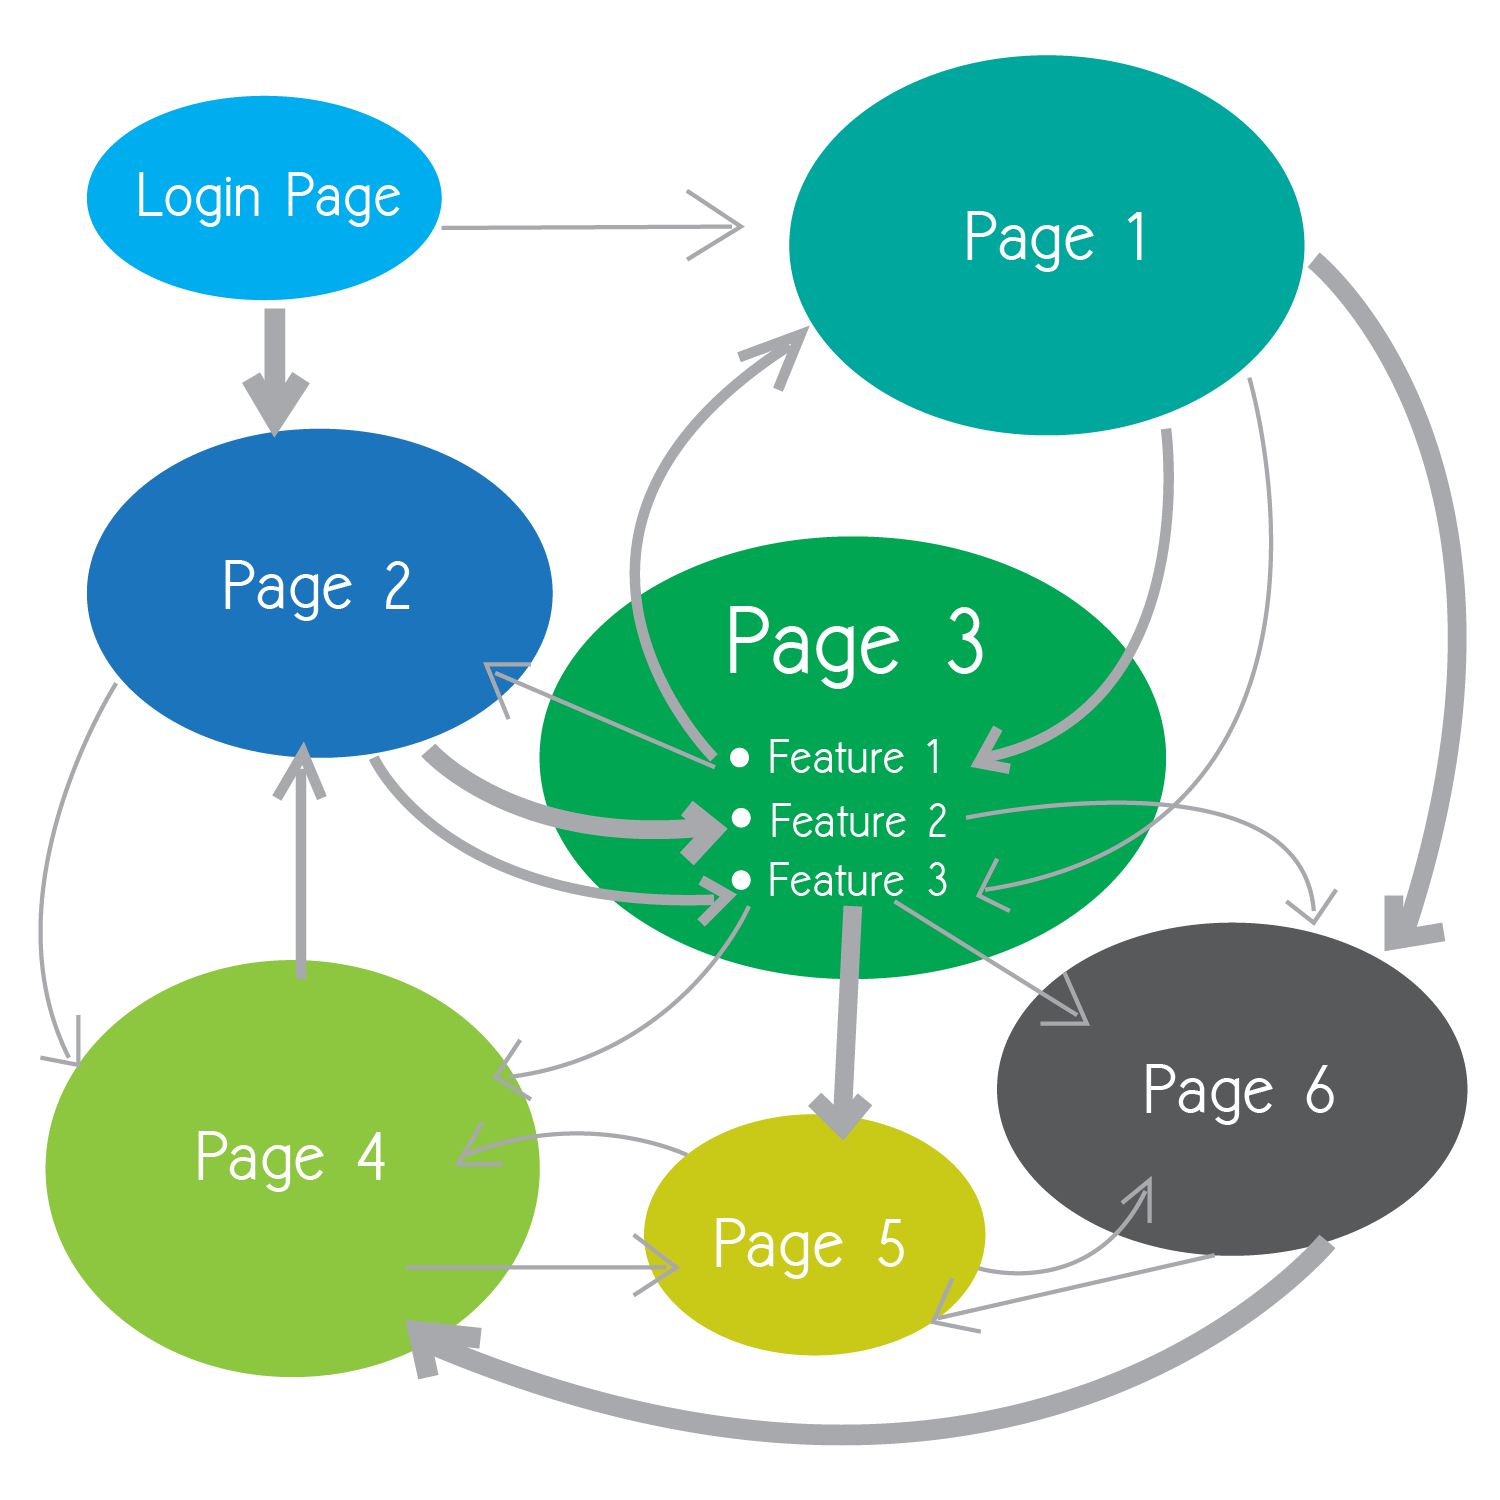
Our next step is to look for workflow patterns. What are common sequences of actions within the product. The goal here is not to arrive at an exhaustive list but to simply understand the which pages and features are heavily used. We find it useful to use arrows of different weight between pages to denote commonly used paths. Heavier the arrow, the more likely a user is to move from one page to the other. When you have many features in a page, list the features within the page and point the arrows to each of the features. This type of pattern analysis is great for figuring out how your first end to end test should look like.
Next we analyze, what we call 'layers' that drive testing. Examples of layers would be the browser, operating systems, screen resolution, time-zones, languages, client hardware resources (RAM, CPU), quality of the network connection, etc. We view each layer as colored lenses through which the quality of your application is perceived. And you likely need to test your software against different combinations of these layers.
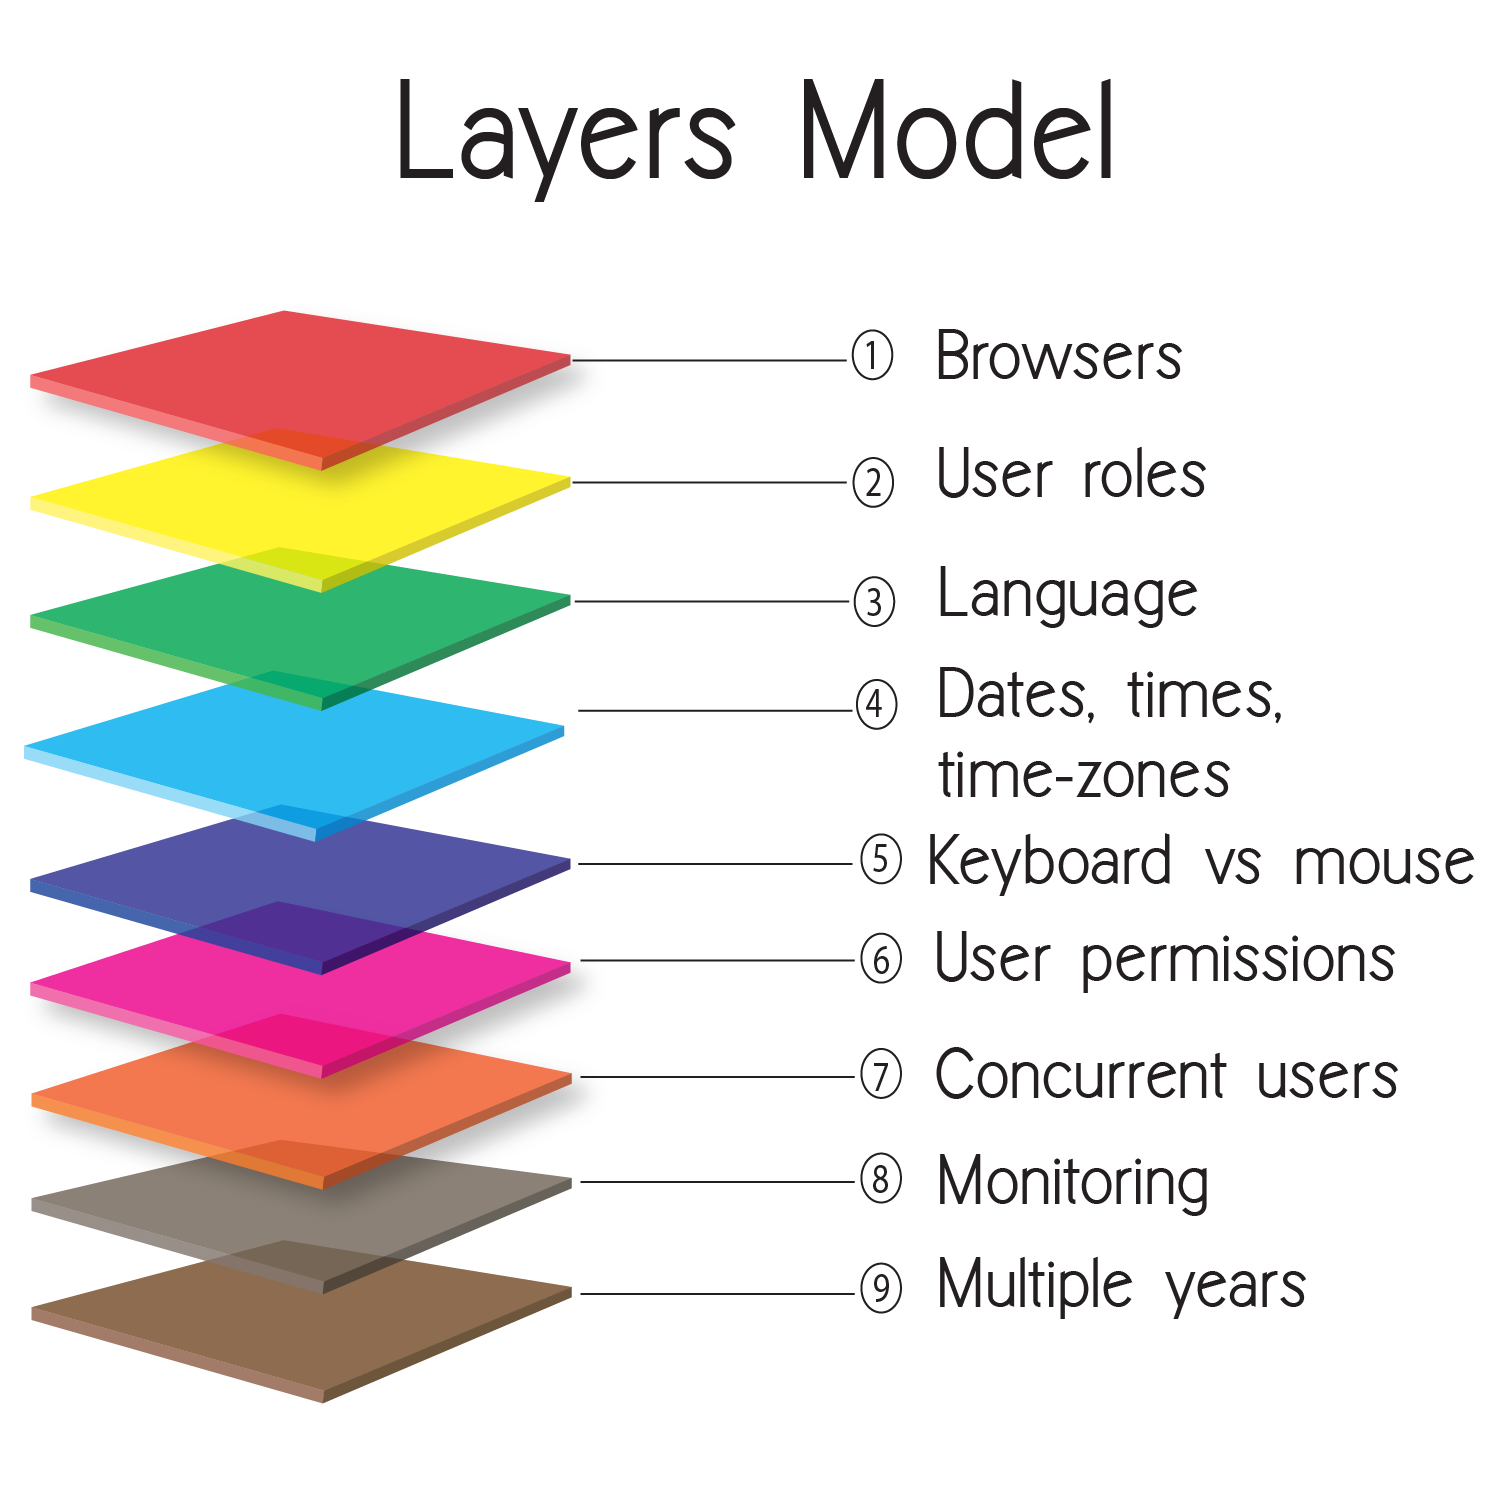
A user accessing your application on IE7 from a Windows XP machine with 2 GB RAM will have a very different experience from another user accessing your application on Safari from a shiny new Mac. Even though the code being executed is (approximately) the same for both users, their experience could be vastly different. Layers tend to multiply testing effort. The breakdown by layers help you notice places where automation can really shine.
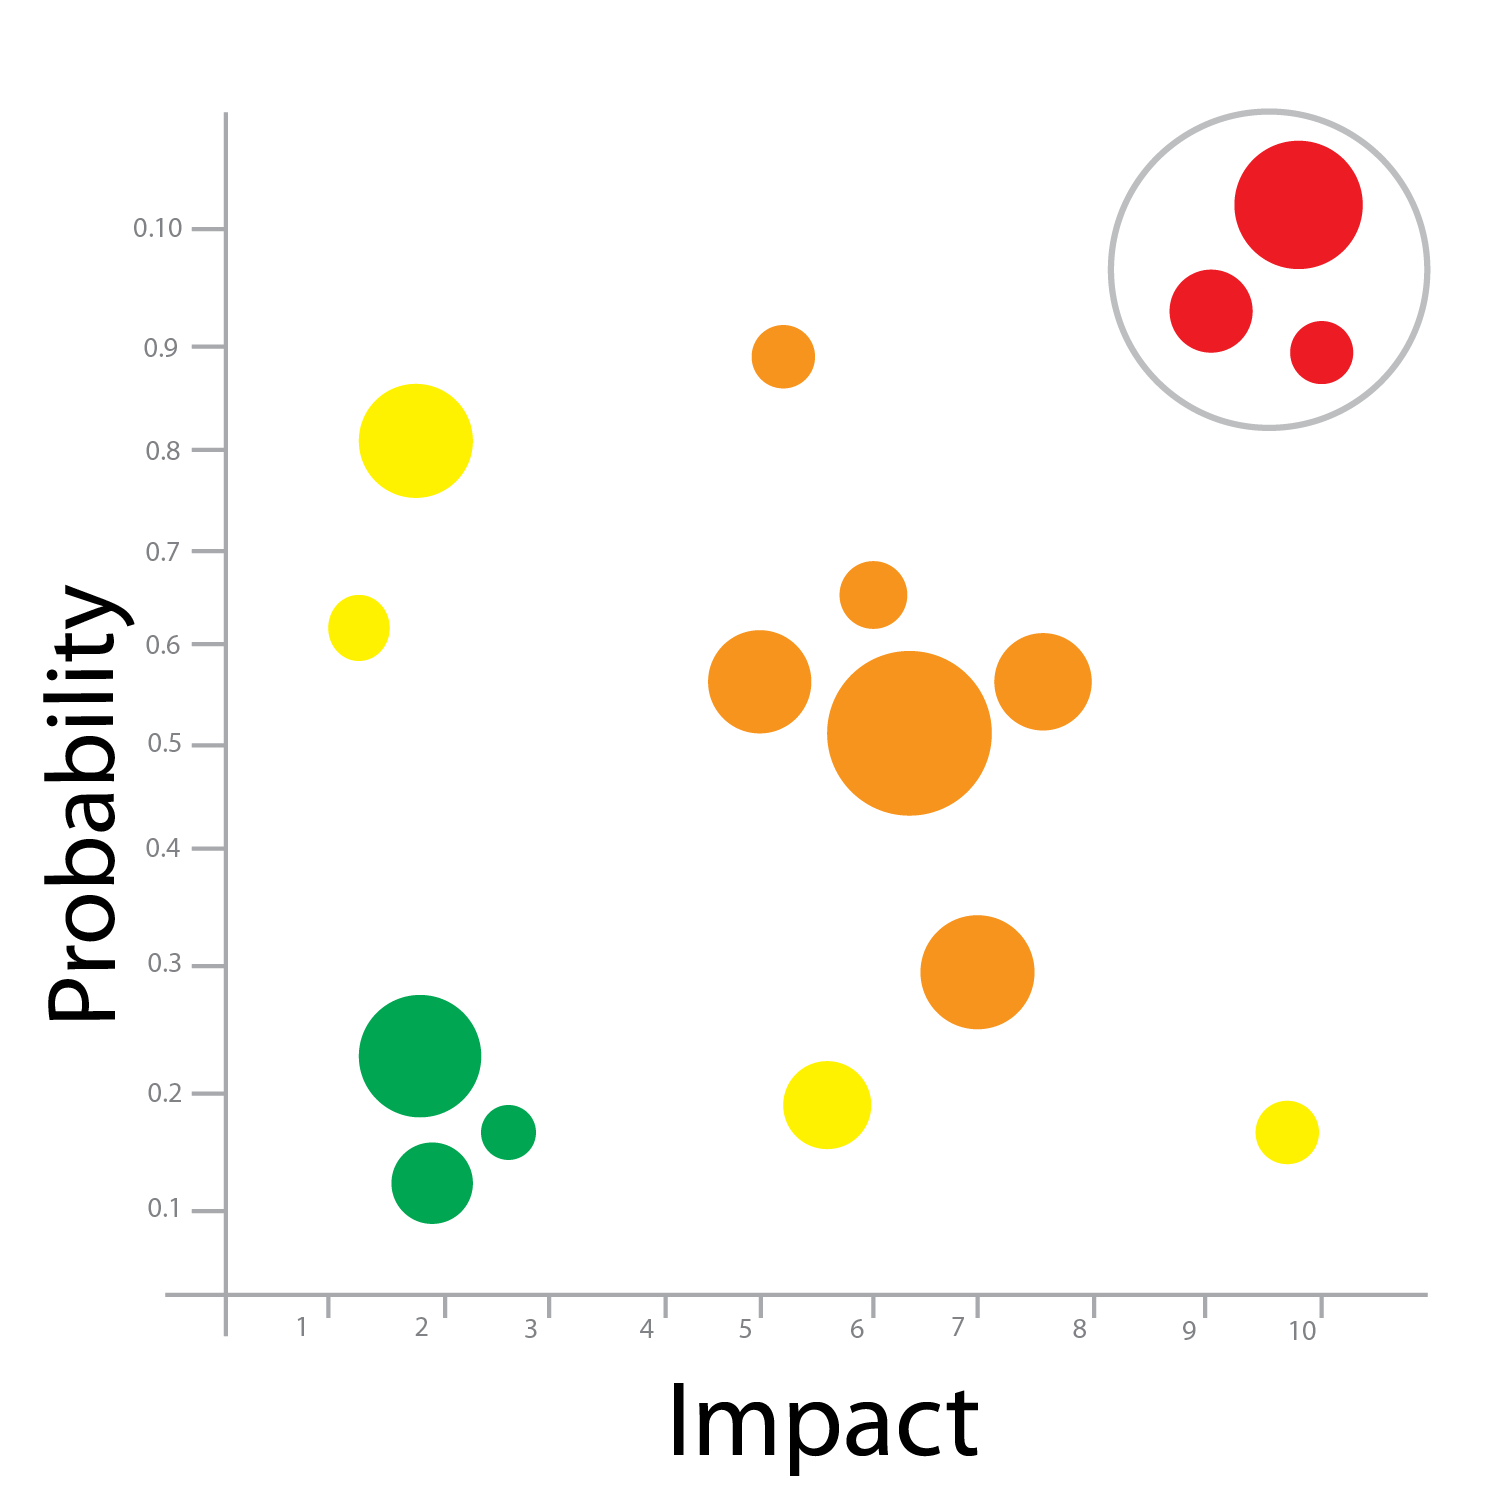
At this stage a quick way to test your own understanding of the product, is to make a scatterplot (impact vs probablity) for recent defects. Impact of the bug could be anything from a large business deal going awry to a defect that prevents an overwhelming majority of your user base from using your product. Probablity is your best guess for how likely your user base is going to run into the issue. As with the other steps, this is your best guess! Note down a couple high impact, high probablity defects for which you can write automated checks.
Once you have performed these six steps, you will likely have a good idea of places where good testing can show immediate value. Set forth confidently knowing that as a thinking tester, you will adapt to what you learn and observe.
© Qxf2 Services 2013 -